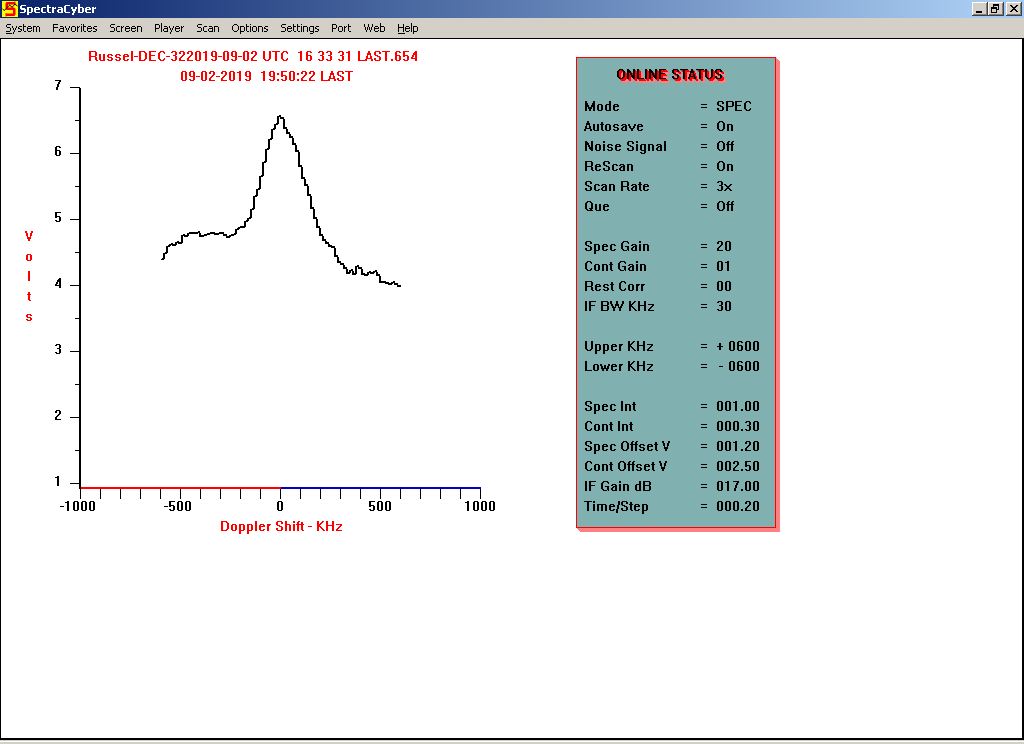
Ray Uberecken came over today with another LNA, which we put in series with the first LNA. This did the trick and overcame our cable loss problem. I conducted a small drift scan across the galactic center at -32 Declination. Here is a quick result.
I will spend the next couple of days fine tuning the azimuth pointing and weatherizing the LNAs.
I will forward information to allow certain members teamviewer access if they want.
Thanks Ray and Steve Plock for their technical support!!
Part 2 – September 4, 2019
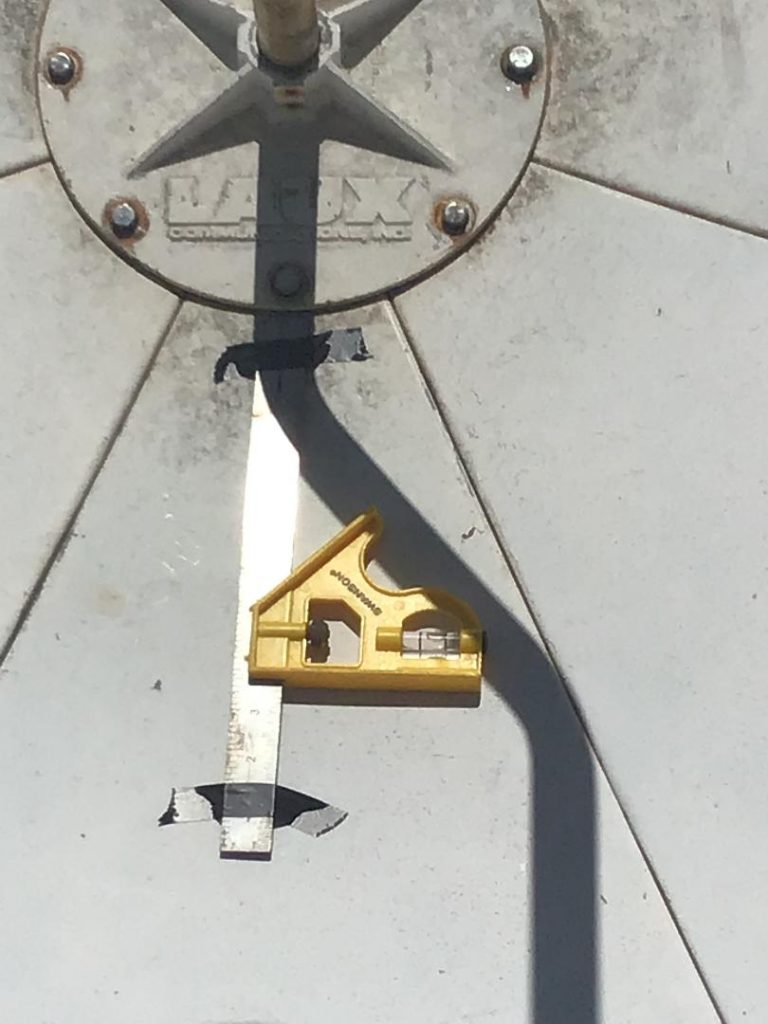
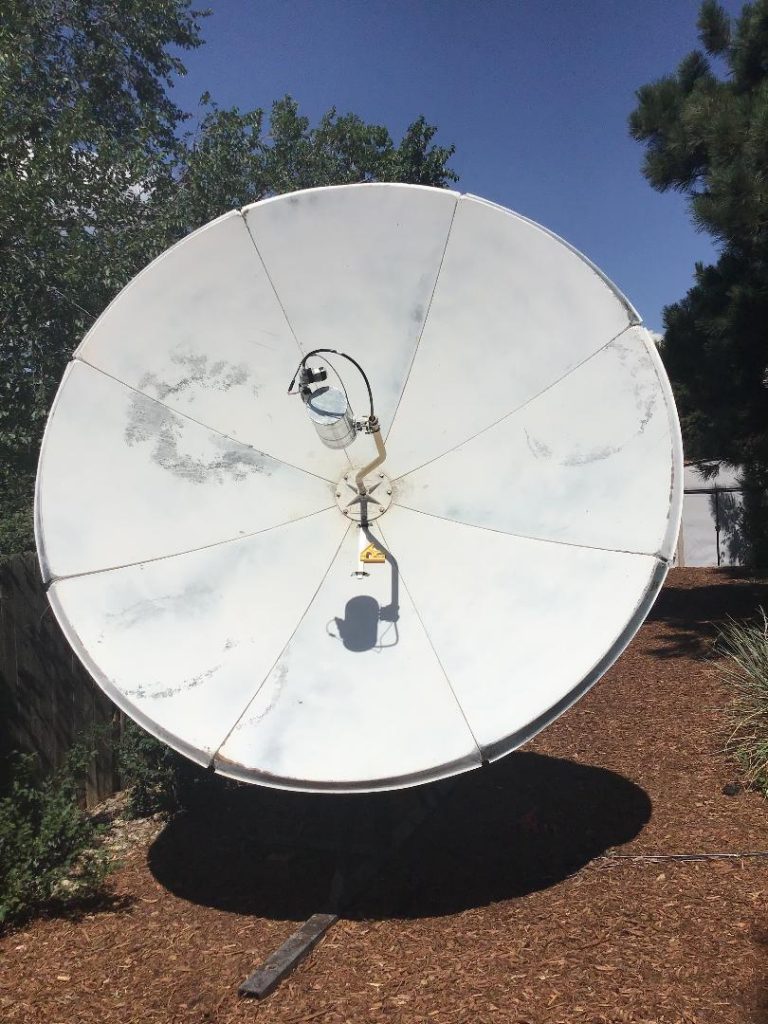
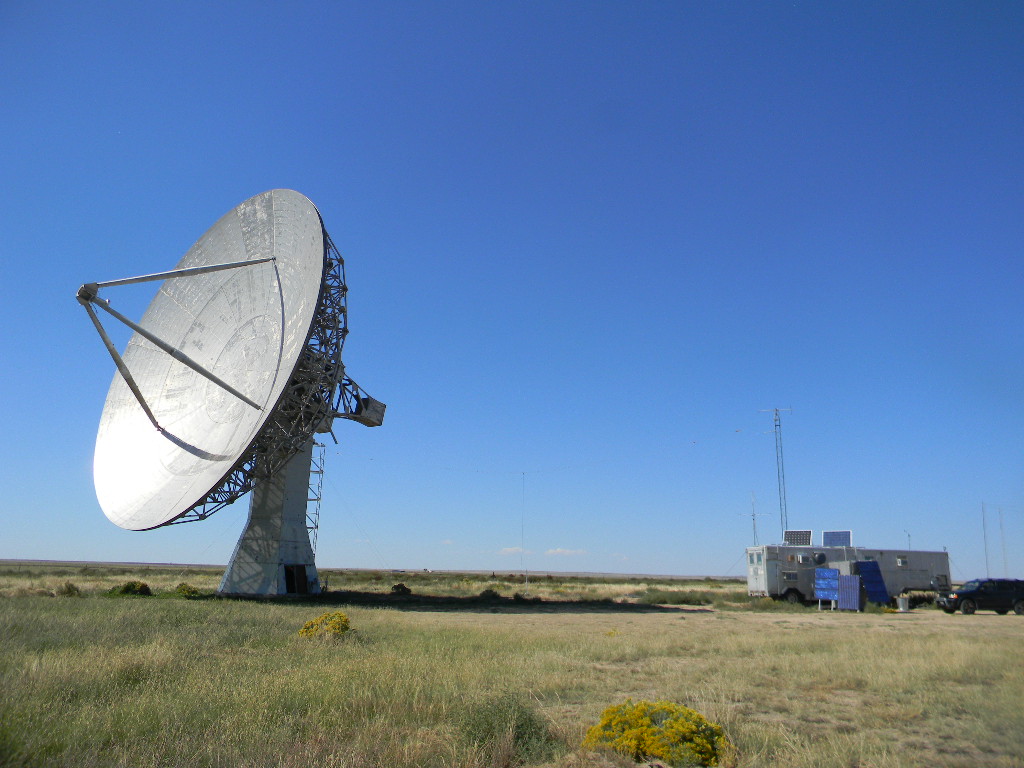
The 9 ft dish at Dr. Russel’s house is operational! It is set up to collect neutral hydrogen frequencies at 1420.406MHz. Today the dish azimuth was aligned using the Sun and a level.
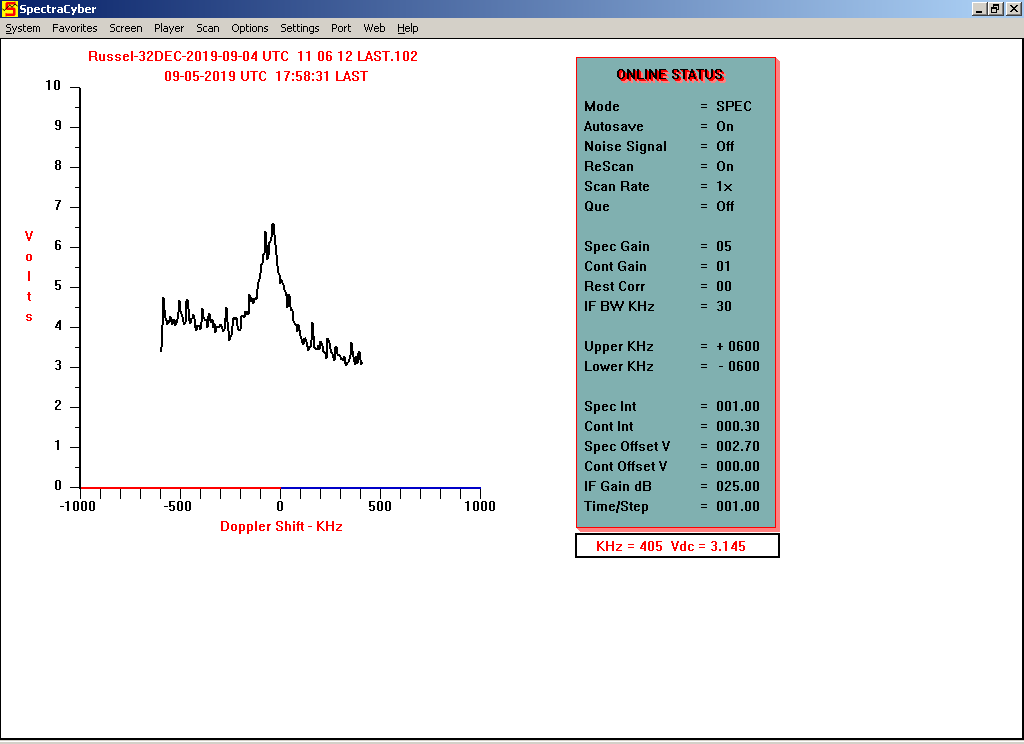
The receiver is a Spectracyber 1 from Radio Astronomy Supplies. Below is the measurement of the hydrogen spectrum near the galactic center. RA 17hr 58min DEC -32 degrees
Training on the use of the system will be conducted at the science meetings.
This is Skip Crilly‘s updated paper/presentation, “Radio Search for Extraterrestrial Intelligence SETI is fun ! Geographically-spaced Synchronized Signal Detection System“, updated July 2019. Skip presented it at the Society of Amateur Radio Astronomers conference at Greenbank, WV on August 4, 2019. The link will open as a pdf file.
During the past year, Dr. Russel led us in measuring the Doppler shifts of galactic neutral hydrogen (HI). Building on his experience from navigation, he then developed his ideas on how to use HI Doppler shift measurements to navigate from star to star across galactic space.
This year we are undertaking measuring the pulse time of pulsars. Pulsars are understood to be the star remnants of supernova explosions. They become what are called neutron stars. The supernovas compress the stars tightly into enormous densities so that their matter become neutrons, and the stars are only about 7 miles in diameter. Due to the conservation of angular momentum, their spin increases very rapidly. The youngest rotate with periods of miliseconds. Their magnetic poles are often offset from their spin axes. Electrons spin rapidly along the outgoing magnetic field lines of the poles, producing synchrotron radiation, which in turn produce broad band radio signals. If a magnetic pole is oriented so that it points at Earth during the rotation, we receive a radio pulse, and maybe pulses at other wavelengths too. (That is how pulsars were first discovered during the late 1960s.)
The pulses are very regular. But the spin of the pulsars gradually lose energy and slow down over time too.
Dr. Russel took his ideas for navigation, and now he has developed a concept for doing interstellar navigation using pulsars as references. That’s what this slide set is about. He just submitted a paper on the topic to the journal of the Society of Amateur Radio Astronomers.
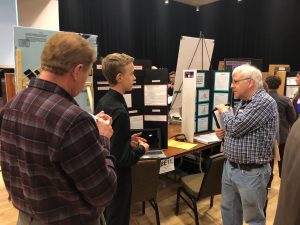
Deep Space Exploration Society members Bill Miller, Gary Agranat, and Tony Bigbee participated as judges at the 2019 Pikes Peak Regional Science Fair. The Fair was held at the University of Colorado at Colorado Springs University Center building on Saturday February 23rd. This year 115 students from 20 schools presented projects. The purpose of the fair is to encourage students to take more active interest in the study of science and mathematics, to encourage experiment and consideration of science careers, and to provide a means of reward and recognition. Informally the fair gives students an opportunity to interact with and get helpful feedback from specialists already in the fields.
Bill and Gary were at the science fair to judge and award prizes specifically offered by DSES. The prizes were offered to encourage projects related to astronomy and radio. However any outstanding STEM project related closely enough to the fields were considered. Bill and Gary interviewed 17 students in 16 projects at the fair, at the middle school and high school levels, with most of the topics in physical sciences or engineering. A scoring criteria was used based on the qualities of the ideas, hypotheses, methods, data, and lessons learned.
DSES awarded one Senior Division prizes and two Junior Division prizes:
For outstanding senior division project we gave a certificate and $100 to Mark Bloomfield. Mark received 6 additional special awards from other organizations, and he placed 3rd in the Fair’s Senior Physical Sciences category.
• Mark Bloomfield [grade 11] [project SC9], Coronado High School/David Bloomfield: ‘‘Charged up: Testing lithium ion battery performance using a Raspberry Pi load cell’’
For the two Junior Division prizes we gave a certificate and $50 each to Hailey Kressen and Benjamin Homan.
• Hailey Kressin [grade8] [project 8E10], The Classical Academy JHS/Candus Muir: ‘‘A sixth sense: Omnidirectional presence detection system’’. Hailey received 6 additional special awards, and she placed 2nd in the Grade 8 Physical Sciences & Engineering category.
• Benjamin Homan[8] [8E1], Monument Academy/Karl Brown: ‘‘Does pressure affect carbondioxide absorption by polyethyleneimine?’’ Benjamin received 5 additional special awards, and he placed 4th in the Grade 8 Physical Sciences & Engineering category.
Tony participated as a general Award Judge for the Fair itself. He judged middle school social and behavioral science projects.
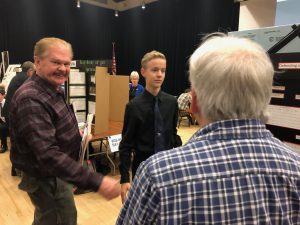
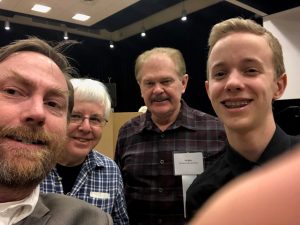
Tony took a few minutes to take some photos. The first three photos are from when Bill and Gary interviewed Connor Takenaka about his cybersecurity project. The third includes Tony.
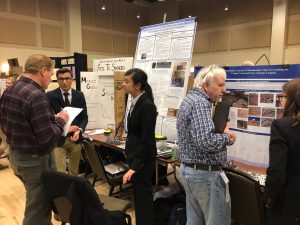
Bill is show interviewing Josh Nakka and Katelynn Salmon for their Senior level science project “Engineering a portable refreshable braille device for improved communication.” Gary is interviewing Jenna Salvat for her Senior level science project “A geothermal analysis of metamorphic lithologies surrounding Cripple Creek and Victor Diatreme”.
Projects Bill and Gary interviewed:
“Shields Up” by Samantha Cerniglia. She tested the ability of several materials to block cosmic rays. She built a cloud chamber to do the tests.
“LED Lights: Hero or Zero” by Michael Wu. He tested energy efficiency savings claims of a set of consumer LED lights, and found those fell short.
“Energy Efficiency” by Samantha Schaefer. She tested the effects of placing different colored filters on solar energy panels.
“This Will Blow You Away” by Levi Archambault. He tested the efficiency of windmills with different number of blades, with different wind speed conditions.
“Prevent Basement Floods” by Austin Cellar. He designed and tested a low cost device to detect basement water leaks and flooding, and send an alarm.
“Cleaning glasses with portable ultrasonics” by Ty Rockey. He researched, designed, and tested a low cost device to clean eye glasses using water cavitation.
“Does Pressure Affect Carbon Dioxide Absorption by Polyethyleneimine (PEI)” by Benjamin Homan. He tested the ability of PEI to absorb carbon dioxide at sea level and 7350 foot elevation pressures. He utilized previous research by others and theory that predicted lower pressure would result in less absorption, due to fewer number of molecules per volume. The material would be applicable to CO2 scrubbers in submarines and spacecraft. Benjamin won one of our two Junior Division prizes.
“Analyzing how various hydroelectric designs can ameliorate the accessibility of tides” by Chandler Wilburn. He tried to design and test an alternate way to generate electrical power from tides, using a large pressure plate instead of flow past a turbine.
“Neodymium field slide” by Amir Laarja. He tested different position configurations of magnets in a generator, to test differences in efficiency.
“A sixth sense: Omni-directional presence detection system” by Hailey Kressin. She designed and tested a system to detect the presence of approaching objects within 1.5 meters in 1 second, to aid people who are blind. Hailey won one of our two Junior Division prizes.
“Cybersecurity: Defending our Computers” by Connor Takenaka. He tested the effectiveness of different length and complexity passwords to prevent or delay hacking.
“Variable scintillation frequency in muon detection” by Xander Duvall.
“Using Solar Radiation” by Erick Lopez. He tested the effectiveness of several designs for homes to retain heat from solar heating.
“Engineering a portable low-cost braille device for improved communication” by Josh Nakka and Katelynn Salmon.
“A geothermal analysis of metamorphic lithologies surrounding the Cripple Creek and Victor diatreme” by Jenna Salvat.
“Charged up: Testing lithium ion battery performance using a Raspberry Pi load cell” by Mark Bloomfield. He developed a Raspberry Pi constant load cell to test how temperature, drain rate, and charging patterns affected energy recovered in charging. Mark won our Senior Division Prize.
Bill presented the DSES awards at the science fair awards ceremony on the following Tuesday, February 26th.
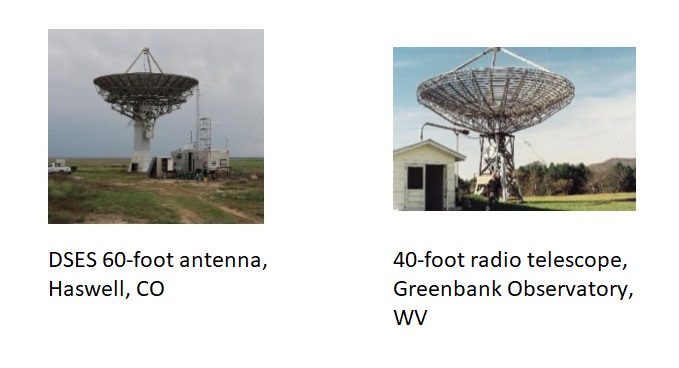
Abstract: Radio Frequency Interference (RFI) is a confounding problem in radio SETI, as false positives are introduced into receiver signals. Various methods exist to attempt to excise suspected RFI, with a possibility that true positives are rejected, and that un-excised RFI remain as false positives. Uncertain far side-lobe antenna patterns add to the uncertainty. To ameliorate the RFI problem, a system having geographically-spaced simultaneous and synchronized reception has been implemented. A radio telescope at the Green Bank Observatory in Green Bank, West Virginia has been combined with a radio telescope of the Deep Space Exploration Society, near Haswell, Colorado to implement a spatial filter having a thrice-Moon-distance transmitter rejection. Approximately 135 hours of simultaneous synchronized pulse observations have been captured from November 2017 through February 2019. This presentation describes the problem, observation system, observed results and a proposed hypothesis to be subjected to attempts at refutation through further experimentation and RFI and ETI transmitter signal model development.
Two wave audio files from the presentation, “Tones” and “Slow Tones”:
These are the presentations from our DSES Science Meeting on November 26, 2018.
Dr. Richard Russel reported on the latest results from the Milky Way galactic rotation rate observations of November 16. Also, he compiled all of the observations of individual radio sources done with the 60-foot antenna with the Spectracyber 1420 MHz receiver. He includes descriptions of the objects and photos, as well frequency plot observations.
Prepared for the Deep Space Exploration Society by Skip Crilly. Revised November 8, 2018.
This is an updated revision of Skip Crilly’s slide set, originally presented last summer. Skip points out that the revision includes a summary of the pulses of November 2017 through November 2018.. Two newer NRAO 5690 plots in the presentation show the very stable performance of the telescope, and the narrower Plishner beamwidth.
Attendance: Gary Agranat, Ed Corn, Floyd Glick, Glenn Davis, Steve Plock, Rich Russel, Tony Bigbee, Ray Uberecken, Dave Molter, Jon Richardson, Bill Miller
Attending Remotely via TeamViewer: Skip Crilly, Dayton Jones, Jamie Riggs
Last Trips: Oct 19 Observation Trip. Oct 20 Work trip for ED. Steve, Hans, Gary, Paul
Next Trips to site: The regularly scheduled 3rd Saturday of the month, Saturday Nov 17th. Observation the night before on Nov 16th
Meeting Schedule:
DSES Technical and Operations Meeting- 2nd Monday of Every Month
DSES Science Meeting – 4th Monday of Every Month
Accuracy: The notes for this meeting may be out of order. This was done to group the discussion into subjects for better clarity and continuity, so they are not true chronological minutes. As always if I have misstated, omitted or misrepresented anyone please feel free to correct me WKM.
Agenda and Notes
Ray Uberecken has his mount ready to install a 12 ft dish with capability up thru the KU band. He needs to move the dish from the KCME radio station to his site in Payton. The dish F/D ratio is the same as the 60 ft Haswell dish, so the 12 ft dish could be used to prototype feeds and receivers for the Plishner site. Ray would like some volunteers from the DSES to help move it next Sunday the 28th at 10AM. (Note: Recent change of plans. Ray will hire a crane to pick the dish out of the KCME yard enclosure before disassembly. This is currently scheduled for 7 AM Saturday, November 10th.) He could use some volunteers, power drills with sockets and a trailer. KCME is at Fontanero and 1921 N. Weber in. Bill will send an EMAIL out to the group.
Once the dish is in place the first thing that Ray will install is a Dicke Switch.
Ray also wants to know if we want to use the 8 channel UHF remote at the site for reset and control of the systems. We have not been using it, but that is available and installed in the communications trailer rack and can be commanded remotely from Ray’s residence.
Ray has also started his optical observatory with 8 inch Celestron and a good refractor at his residence.
Dr. Rich Russel reviewed his new Radio Astronomy Guide Rev. 3.
The RA/Dec of many of the objects are from both celestial coordinate year 1950 epoch and year 2000 epoch, so needs updating.
The output of the SpectraCyber is in volts and a translation to Jansky is needed.
Rich and Gary observed a number of sources on the Oct. 19th observation trip.
Some source positions were very good. Others were not. This may indicate a pointing error or other system issue.
They were getting a lot of clear source signatures but don’t know what many of them were. Rich would like to do cross galactic scans while changing declination to map the whole area in the future.
Cassiopeia A, Cas-A, was thought to be seen, but at a relatively low amplitude. Cas-A, being a 2200 Jy source it should have been clearly seen but they weren’t sure they had it.
Sagittarius A was strong and had the instrument setup with too high of gain, resulting in scale saturation.
Special sources 1 and 2 were studied.
The special source 2, a contact binary star is getting close to a supernova event in a few years, and we want to baseline it and get ready to observe the supernova emission.
To find objects Gary used the tables in Rich’s observing guide and in the Data Book “Astrophysical Data: Planets and Stars” by Kenneth R. Lang.
The V notch object that Tony studied was not tried in Rich and Gary’s session.
Galaxy Observations:
Rich and Gary also did an experiment to measure the hydrogen (HI) Line Doppler shift and therefor the velocity along the galactic plane. They were able to get reasonable hydrogen measurements of the galaxy’s rotational velocity at multiple points from the center out to the radius of the sun.
Rich plotted these observations and got a curve that is in the ballpark but a little different than the published data on similar measurements. This is the first time that the Galactic angular velocity measurement has been attempted with the 60 ft. dish.
See Dr. Rich Russel’s attached Science Meeting presentation for more detail on the site trip and the observations mentioned above.
Tony Bigbee also went to the site for the observing session last week. Tony installed onto the system after Rich and Gary had finished. He did not get the expected results on the RASDR 4 receiver when attached to the 60 ft. dish over the weekend. He thought that the issue may be with the pointing accuracy of the System 1 controller. We used System 2 at the open house when Tony had very good results but did not get the same on this last weekend’s observation session using System 1. Tony looked for the V notch absorption object and is using a new code to calculate the source amplitude. He did not get good results on this and suspects pointing error.
He calculated the curves for the open house and last weekend’s observations showing time and discovered that these are different indicating that something is wrong between the two.
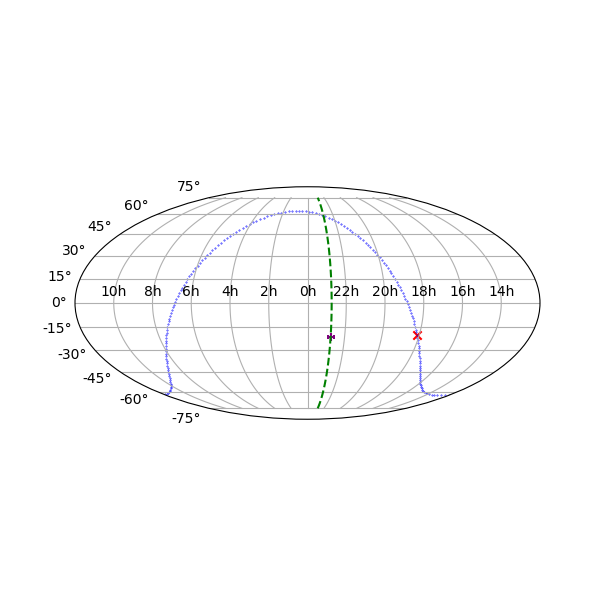
Tony did a Mollweide projection plot like the one below. In Tony’s plot the green line is the meridian, the blue line is the galactic plane. The black X is the position of the telescope. See Tony Bigbee’s actual plot when he posts or sends it out.
Figure 1 Example of a Mollweide Projection
Rich suggests that anyone going down to observe should measure some of these same sources and get data to compare their results.
SkipCrilly says we have aligned NRAO 5690 at Greenbank and Haswell sites three times using the System 1 controller and it seems to be positioning correctly. Steve can do an additional observation next week, Tuesday and Wed and verify the alignment.
Another difference from the open house observation was that Steve Plock added the alternate cavity filter configuration.
As mentioned previously the coordinates of some of the sources are from celestial coordinate year 1950 epoch and year 2000 epoch so may be different positions now due to precession and galactic movement. A mathematical correction to the coordinates may be required to make an accurate set of coordinates for the current date. However, the small difference afforded by this is probably within the capture angle of the dish.
Glenn Davis says that his NTP time sever may be useful to improve the accuracy of the pointing systems.
Bill Miller said that the System 1 controller may still have a discontinuous elevation reading error. This was seen previously this summer and has not been fixed. This could contribute to a pointing error and inaccuracy on some coordinates.
Additional Considerations:
Anyone going to do observations at the site should try to replicate the studies of the observation guide and use the Observation Checklist to make their session useful and comparative.
Currently the LMST is close to local time, and so one needs to consider this and observe in the evening instead of afternoon.
See the back of Rich Russel’s observing guide for dish rules and limits. An observation data sheet and suggestions are available in the back of the guide as well.
We need a list of some calibration sources to start all observing session with, to be sure that the pointing system is working properly and that it isn’t broken with new SW drops. Also, we hope the voltages we measure from calibration sources (with known Jansky levels), will enable us to derive the Janskies of other objects we wish to observe. Janskies are the measure of the flux density that the antenna receives.
Three papers have been accepted in the next SARA journal.
“The Deep Space Exploration Society 2018 Perseid Meteor Shower Open House”. By Bill Miller, Gary Agranat. Deep Space Exploration Society.
“SpectraCyber Neutral Hydrogen Measurements using the Deep Space Exploration Society 60 – foot Antenna System“. By Richard Russel D.Cs., Ae.E.; Gary Agranat. Deep Space Exploration Society.
“Dark HI Cloud Observation using the Deep Space Exploration Society Plishner 18 – Meter Dish with the RASDR4“. By Tony Bigbee, Richard Russel, Steve Plock. Deep Space Exploration Society.
Skip Crilly discussed his new 28 ft. antenna that has a 5 pixel or 5 separate antenna segment feed and is mounted on a cargo trailer but will be used mostly for SETI. The antenna may not be large enough to observe the strange signals we have seen. File size is one challenge since it is inversely proportional to the gain and noise ratio.
Meeting was adjourned after much secondary discussions not captured here.
Old 9/24/2018 Agenda and Notes from last science meeting:
Glenn Davis proposes a graphical user interface called Astro Guide that would allow better guiding and tracking of radio sources.
Rich’s presentation and overview of the radio astronomy guide
Started with Floyd’s list
Added the 1420 MHz sources from the book “Tools of Radio Astronomy” by K Rohlfs and T Wilson.
Added the hydrogen measurements from K5SO, Dr. Joe Martin who has provided signature images of the objects.
Gary, Jay Wilson, Rich and Steve all went to the site on 9/22 and did observations using the 60 foot dish.
Used Spectra Cyber
Used system 1 pointing
Used the new setup with the cavity filter
Limit switches are set at +/-15 ether way of north. CCW to 345. CW to 015.
Gary got great pictures of the event.
Need screen print capability to capture the Spectra Cyber parameters display.
The Spectra Cyber SW is easy to take the data and use it.
Need a Lap Top with a com 2 serial port to attach the spectra cyber. This is difficult because most of the Serial to USB port adapters don’t want to set for Com1 or Com2.
Need to do calibration sources before and after observation of an observed object and keep all settings on the Spectra Cyber the same.
From Tony, “To avoid problems of solar interference all observations were made between sunset and sunrise. Most scans were taken with the telescope on the meridian.” Galt and Kennedy, 1968, ‘Survey of Radio Sources Observed in the Continuum near 1420 MHz, Declinations —5° to +70°’ http://adsabs.harvard.edu/abs/1968AJ…..73..135G
Rich presented a number of plots from their observations. See Rich’s report.
The scan across the galaxy were at one RA. The radio hot area was offset from the optical.
The galactic rotation rate was also observed.
Got a lot of raw data, learned how to catalog it and analyze it.
The calibration sources did not show any signal above the noise.
Got good data for Sagittarius A, SAG A.
3 Papers have been submitted for the SARA Journal.
The Western SARA conference is in Boulder in March.
These are the slides from Dr. Richard Russel’s presentation about the radio astronomy observations conducted at the Plishner site during the previous Saturday, September 22. The observing period was chosen for Saturday afternoon, when the Milky Way around the galactic center was starting to rise high enough in the east. Observations were done using the Spectracyber at the 1420 MHZ neutral hydrogen I (HI) frequency.
Goals for the observing included 1) using our in-house Radio Astronomy Guide as an observing reference, 2) seeking strong enough sources listed in our guide that could serve as calibration references, 3) scanning perpendicularly across the plane of the Milky Way to observe changes in hydrogen signal while pointed inside and outside the galactic plane, 4) starting a series of doppler shift measurements along the plane of the Milky Way at galactic longitudes 10 degrees apart.
Some sources were found, but some were not. Among those found were Centarus A, Sagitarius A, and Virgo A. A number of peaks in the hydrogen signal were seen where we didn’t have any reference information that sources were present. The scan perpendicularly across the galactic plane showed the higher concentration of hydrogen in the galactic plane. We likely also detected the weaker signal of hydrogen known to be above and below the plane in certain regions. For this observing set, some sources like Sag-A were so strong that they oversaturated the voltage scale we had initially set. Doppler shifts were measured at 5 points, 10 degrees apart, along the galactic plane. Please see the slides for details.
Please click the link to see the power point slide show.